173. Graphing and Solving Inequalities
Learning Intentions
- Recognise that graphs can be used to Solve inequalities
- Draw horizontal and vertical lines given their equation
- Draw inequalities Use horizontal and vertical lines as regions in the plane
- Solve simple inequalities using graphs
Pre-requisite Summary
- Coordinates are written as ordered pairs
- A horizontal line has the form
, where is a constant - A vertical line has the form
, where is a constant - Points on a graph satisfy the equation of the line they lie on
- An inequality compares values using symbols such as
, , and - A graph of an inequality shows a whole region of points, not just a single line
- A solid boundary line is used when the boundary is included, and a dashed boundary line is used when it is not included
- The solution to an inequality in the plane is the set of all points in the shaded region
Worked Examples
Worked Example 1
Sketch the horizontal line
Worked Example 2
Sketch the vertical line
Worked Example 3
Graph the inequality
Worked Example 4
Graph the inequality
Worked Example 5
State whether the point
Worked Example 6
State whether the point
Worked Example 7
Use a graph to solve
Worked Example 8
Use a graph to solve
Problems
Problem 1
Sketch the horizontal line
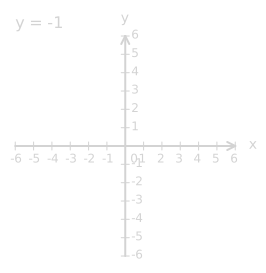
Problem 2
Sketch the vertical line
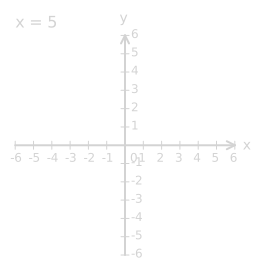
Problem 3
Graph the inequality
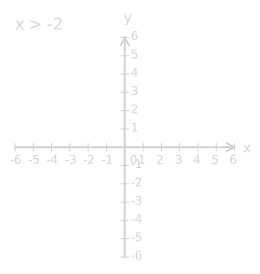
Problem 4
Graph the inequality
Problem 5
State whether the point
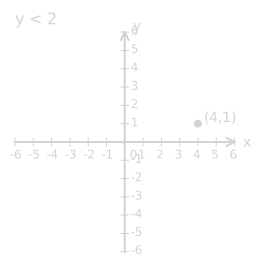
Problem 6
State whether the point
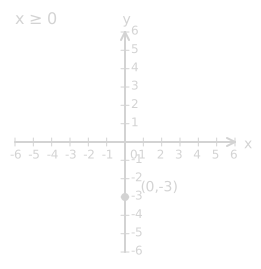
Problem 7
Use a graph to solve
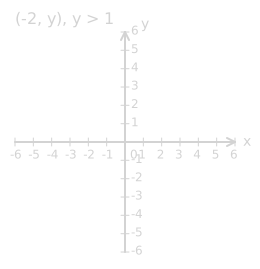
Problem 8
Use a graph to solve
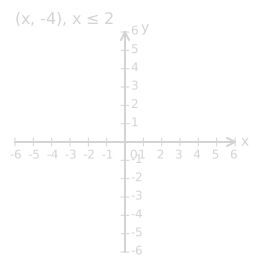
Exercises
Understanding and Fluency
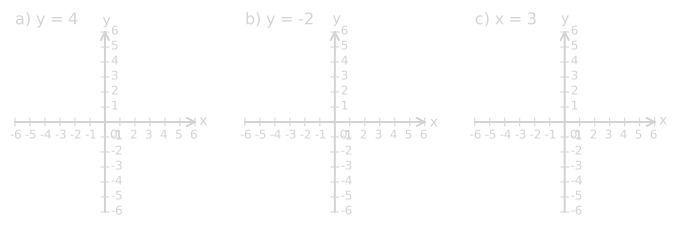
Exercise 1.
Sketch each line.
a)
b)
c)
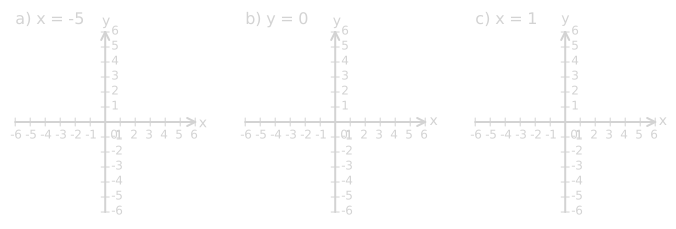
Exercise 2.
Sketch each line.
a)
b)
c)
Exercise 3.
State whether each line is horizontal or vertical.
a)
b)
c)
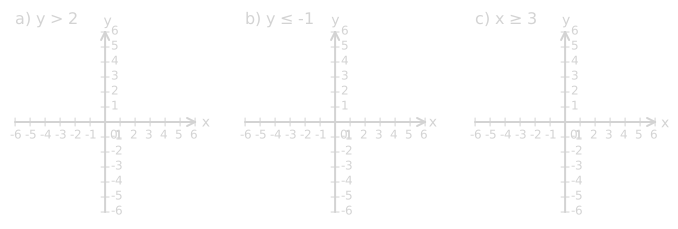
Exercise 4.
Graph each inequality.
a)
b)
c)
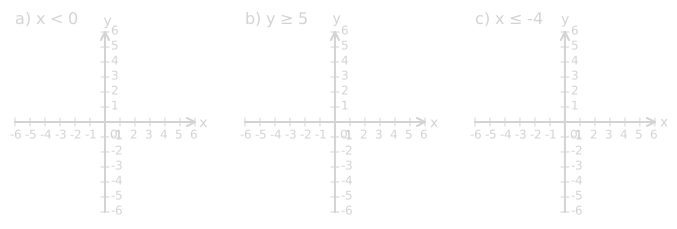
Exercise 5.
Graph each inequality.
a)
b)
c)
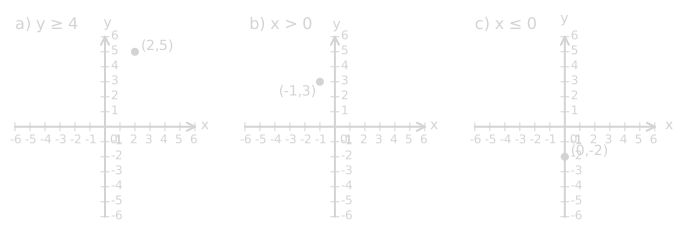
Exercise 6.
State whether each point is a solution to the inequality.
a)
b)
c)
Exercise 7.
State whether each point is a solution to the inequality.
a)
b)
c)
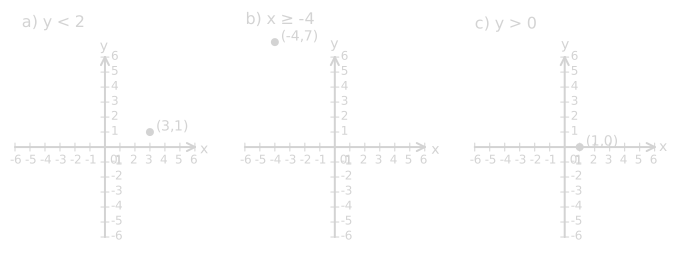
Exercise 8.
For each point, decide which inequality is satisfied.
a)
b)
c)
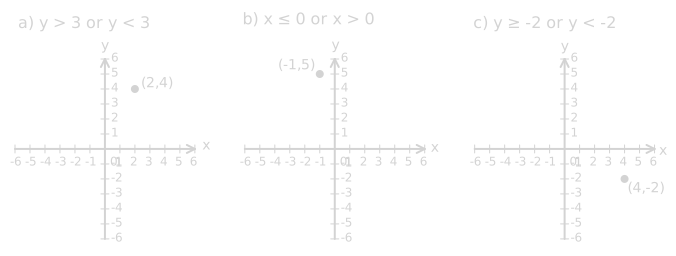
Exercise 9.
Use a graph to solve each.
a) For the point
b) For the point
c) For the point
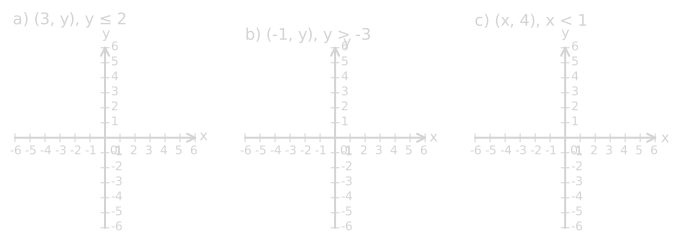
Exercise 10.
Use a graph to solve each.
a) For the point
b) For the point
c) For the point
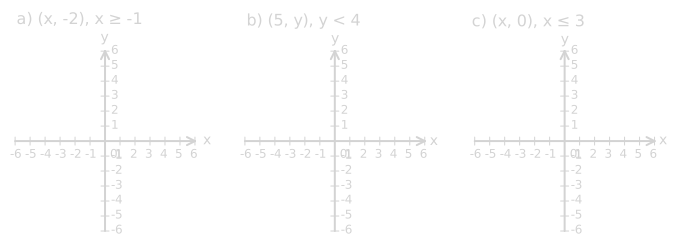
Reasoning
Exercise 11.
Explain why the graph of
Exercise 12.
Explain why the graph of
Exercise 13.
A student uses a solid line to graph
Exercise 14.
Explain why the graph of an inequality represents many solutions, not just one point.
Exercise 15.
A student says that the point
Exercise 16.
Explain why points on the line
Problem-solving
Exercise 17.
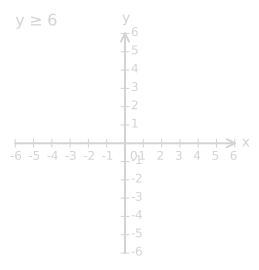
A temperature map uses the inequality
Graph the inequality and Describe the region.
Exercise 18.
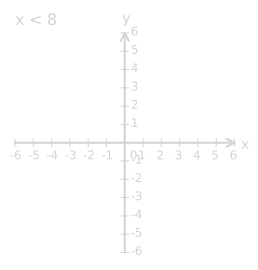
A parking rule is modelled by
Graph the inequality and explain whether
Exercise 19.
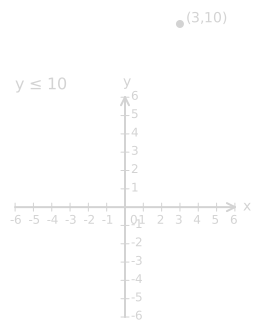
A drone may only fly at heights
Graph the inequality and decide whether the point
Exercise 20.
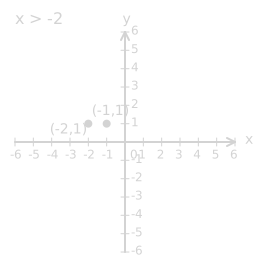
A game board uses the rule
Graph the inequality and decide whether the points
Potential Misunderstandings
- Thinking the graph of an inequality is only the boundary line and not the whole region
- Confusing horizontal lines of the form
with vertical lines of the form - Reversing the roles of
and when sketching a line - Using a solid line for
or instead of a dashed line - Using a dashed line for
or instead of a solid line - Forgetting that points on the boundary are included only when the inequality has
or - Thinking a graph of an inequality gives only one solution
- Shading the wrong side of the boundary line
- Believing that a point on a boundary line always satisfies the inequality
- Forgetting to test whether a given point lies in the shaded region