171. Finding Linear Rules from Tables and Graphs
Learning Intentions
- Recognise that the rule for a linear equation can be determined from a table of values
- Determine the rule for a table of values
- Determine the rule from a linear Draw when the coordinates are known for integer values of
Pre-requisite Summary
- A relationship between
and can be shown Use a table of values or a graph - A linear relationship changes by a constant amount as
increases by equal steps - Ordered pairs are written as
- A point lies on a graph if its coordinates satisfy the rule
- Substitution can be used to test whether a rule matches a table or graph
- The rule for a linear relationship can often be written in the form
- The coefficient of
shows how much changes when increases by - The constant term shows the value of
when
Worked Examples
Worked Example 1
Solve the rule for the table of values.
Worked Example 2
Find the rule for the table of values.
Worked Example 3
Find the rule for the table of values.
Worked Example 4
A linear graph passes through the points
Determine the rule.
Worked Example 5
A linear graph passes through the points
Determine the rule.
Worked Example 6
A student says the rule for the table below is
Test the claim and determine the correct rule.
Problems
Problem 1
Find the rule for the table of values.
Problem 2
Find the rule for the table of values.
Problem 3
Find the rule for the table of values.
Problem 4
A linear graph passes through the points
Determine the rule.
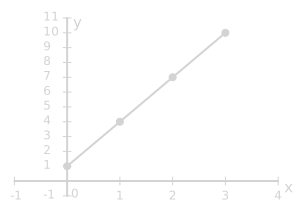
Problem 5
A linear graph passes through the points
Determine the rule.
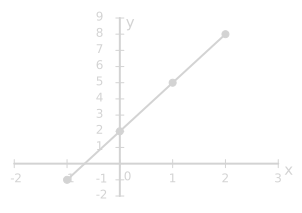
Problem 6
A student says the rule for the table below is
Test the claim and determine the correct rule.
Exercises
Understanding and Fluency
Exercise 1.
Decide whether each table shows a linear relationship.
a)
b)
Exercise 2.
Find the rule for each table.
a)
b)
Exercise 3.
Find the rule for each table.
a)
b)
Exercise 4.
Determine the rule from each set of points.
a)
b)
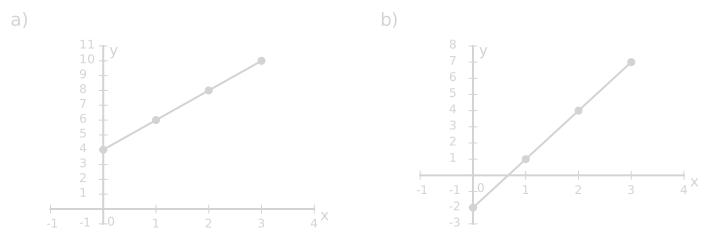
Exercise 5.
Determine the rule from each set of points.
a)
b)
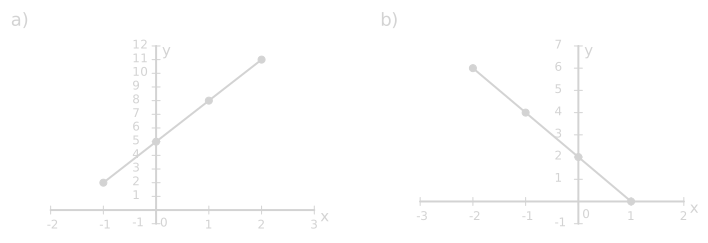
Exercise 6.
For each table, first find how much
a)
b)
Exercise 7.
A linear graph passes through the integer-coordinate points shown. Determine the rule.
a)
b)
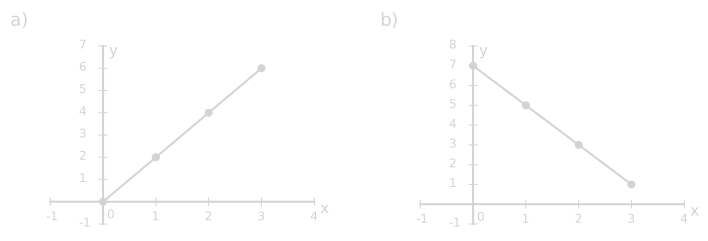
Exercise 8.
A linear graph passes through the integer-coordinate points shown. Determine the rule.
a)
b)
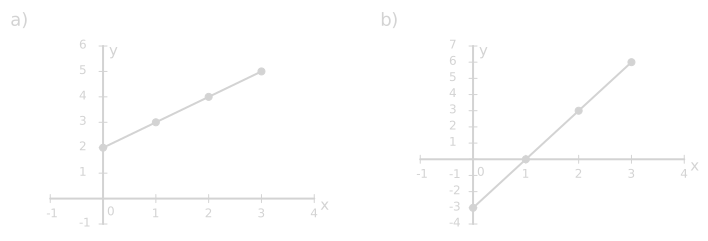
Reasoning
Exercise 9.
Explain why a constant change in
Exercise 10.
A student says that because the values of
Exercise 11.
Explain why the value of
Exercise 12.
A student looks at the points
Problem-solving
Exercise 13.
A pattern table shows the number of tiles in each figure.
| Figure number | ||||
|---|---|---|---|---|
| Number of tiles |
Determine the rule connecting figure number and number of tiles.
Exercise 14.
A taxi fare is shown in the table below, where
Determine the rule.
Exercise 15.
A line on a graph passes through the points
Determine the rule.
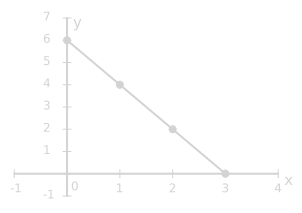
Exercise 16.
The table below shows the relationship between the number of weeks
Determine the rule.
Potential Misunderstandings
- Thinking any table of values must represent a linear relationship
- Forgetting to Check whether the change in
is constant - Confusing the coefficient of
with the constant term - Using the first value of
as the coefficient of - Forgetting that the constant term is the value of
when - Reversing the roles of
and when reading a table or graph - Guessing a rule without testing it against all the given values
- Thinking a rule from a graph can be found from only one point
- Ignoring negative values when determining the pattern in a table