170. Tables and Graphs of Relationships
Learning Intentions
- Recognise that a relationship between variables
and can be shown as a table or as a Draw - Understand that a point lies on the graph of an equation if substituting the values for
and makes the equation true - Draw a table of points for a rule
- Construct a graph from a rule or a table of points
Pre-requisite Summary
- Coordinates are written as ordered pairs
- The first coordinate gives the horizontal position and the second coordinate gives the vertical position
- Points can be plotted on a number plane Use their coordinates
- A rule or equation can connect two variables
- Substitution means replacing a variable with a chosen value
- A table of values can show matching values of
and - A graph can show the same relationship visually
Worked Examples
Worked Example 1
The rule is
Construct a table of values for
Worked Example 2
The rule is
Construct a table of values for
Worked Example 3
Determine whether each point lies on the graph of
a)
b)
c)
Worked Example 4
Determine whether each point lies on the graph of
a)
b)
c)
Worked Example 5
Construct a graph for the rule
Worked Example 6
Construct a graph from the table of points:
Problems
Problem 1
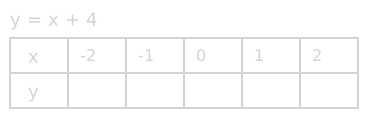
The rule is
Construct a table of values for
Problem 2
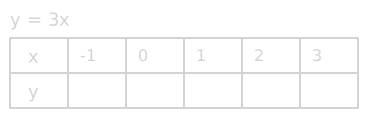
The rule is
Construct a table of values for
Problem 3
Determine whether each point lies on the graph of
a)
b)
c)
Problem 4
Determine whether each point lies on the graph of
a)
b)
c)
Problem 5
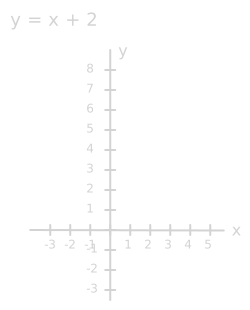
Construct a graph for the rule
Problem 6
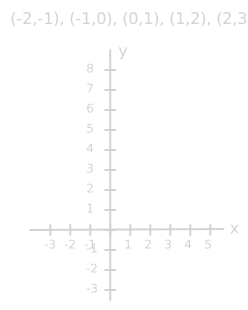
Construct a graph from the table of points:
Exercises
Understanding and Fluency
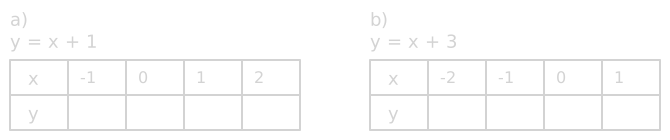
Exercise 1.
Complete each table of values.
a) For
b) For
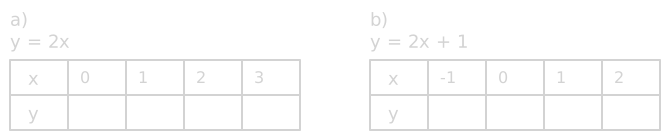
Exercise 2.
Complete each table of values.
a) For
b) For
Exercise 3.
Decide whether each point lies on the graph of
a)
b)
c)
Exercise 4.
Decide whether each point lies on the graph of
a)
b)
c)
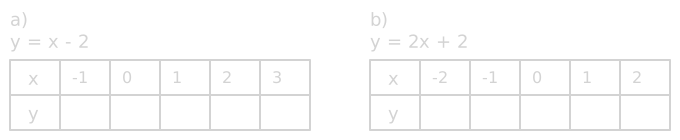
Exercise 5.
Construct a table of values for each rule.
a)
b)
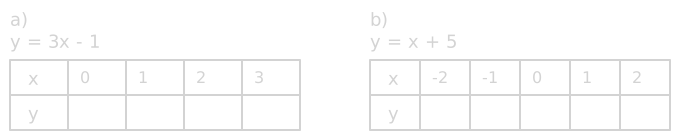
Exercise 6.
Construct a table of values for each rule.
a)
b)
Exercise 7.
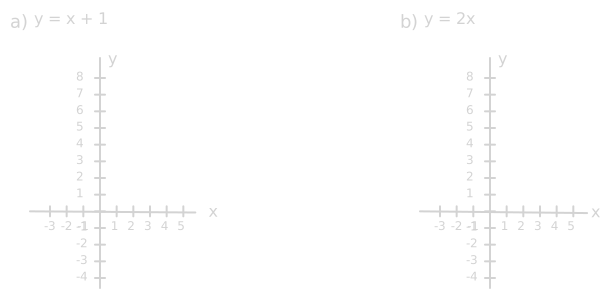
Plot the points from your table and construct the graph of each rule.
a)
b)
Exercise 8.
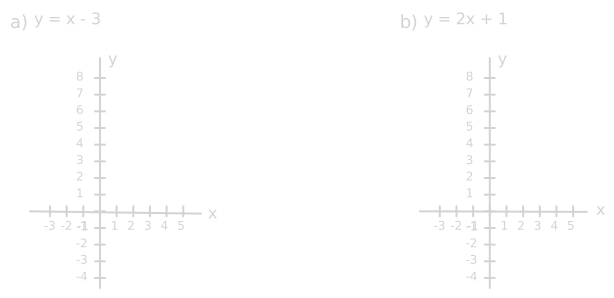
Plot the points from your table and construct the graph of each rule.
a)
b)
Exercise 9.
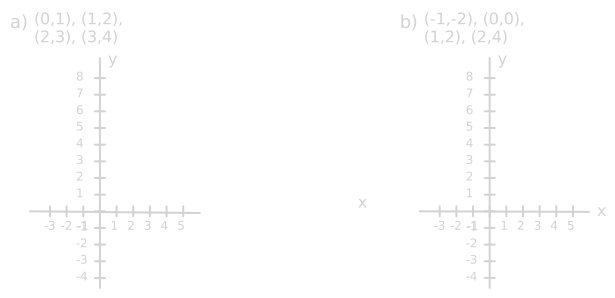
Construct a graph from the table of points.
a)
b)
Exercise 10.
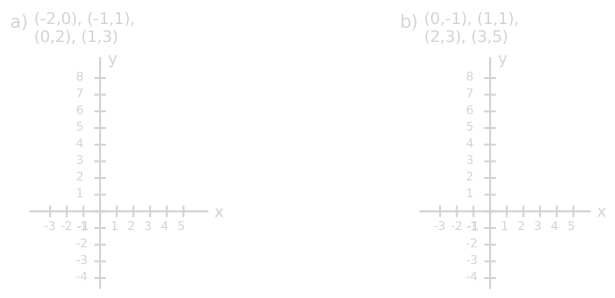
Construct a graph from the table of points.
a)
b)
Reasoning
Exercise 11.
Explain why a table of values and a graph can show the same relationship between
Exercise 12.
A student says that the point
Exercise 13.
Explain why substitution can be used to test whether a point lies on a graph.
Exercise 14.
A student plots the point
Exercise 15.
Explain why more than one point is needed to construct a graph from a rule.
Problem-solving
Exercise 16.
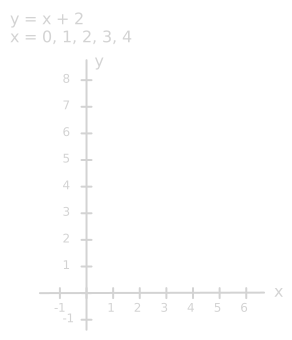
The rule
Construct a table of values for
Exercise 17.
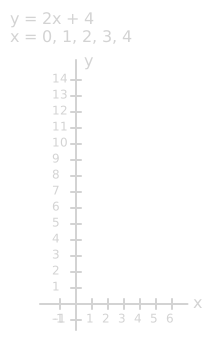
A taxi fare follows the rule
Construct a table of values for
Exercise 18.
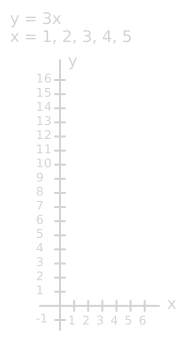
A pattern follows the rule
Construct a table of values for
Exercise 19.
A student claims that
Use substitution to test the claim.
Exercise 20.
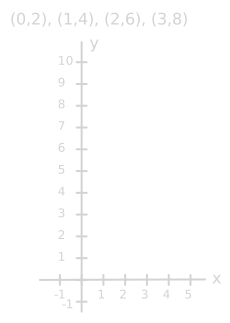
The points
Construct a graph from the table of points and Describe the rule connecting
Potential Misunderstandings
- Thinking a table and a graph show different relationships rather than the same relationship in different forms
- Reversing the order of coordinates when plotting points
- Forgetting that a point lies on a graph only if its coordinates make the equation true
- Substituting the
-value correctly but not checking whether the given -value matches - Treating any plotted point near a graph as if it lies exactly on the graph
- Using inconsistent
-values when constructing a table of points - Making arithmetic errors when substituting into a rule
- Joining points incorrectly when drawing a graph from a table
- Thinking one point is enough to determine the full graph of a rule
- Forgetting that the graph should be based on the ordered pairs in the table