071. Stem-and-Leaf Plots
Learning Intentions
- Interpret a stem-and-leaf plot
- represent data in a stem-and-leaf plot
Pre-requisite Summary
- Understand that numerical data can be organised to make patterns easier to see
- Be able to order a set of whole numbers from smallest to largest
- Understand place value, especially tens and ones
- Know that a data display should show each value clearly and accurately
- Be able to Identify the smallest and largest values in a data set
- Understand that repeated values can occur in a data set
Worked Examples
Worked Example 1
A stem-and-leaf plot is shown below:
a) List the data values represented.
b) State the smallest and largest values.
c) How many data values are there?
Worked Example 2
A stem-and-leaf plot is shown below:
a) Interpret the plot by listing the data values.
b) State how many values are in the teens.
c) State the mode.
Worked Example 3
Represent the following data in a stem-and-leaf plot:
Worked Example 4
Represent the following data in a stem-and-leaf plot:
Worked Example 5
A stem-and-leaf plot is shown below:
a) Interpret the plot by writing the ordered data.
b) State the median.
c) State the range.
Worked Example 6
Represent the following data in a stem-and-leaf plot and then interpret it:
a) Draw the plot.
b) Identify the mode.
c) State the number of data values.
Problems
Problem 1
A stem-and-leaf plot is shown below:
a) List the data values represented.
b) State the smallest and largest values.
c) How many data values are there?
Problem 2
A stem-and-leaf plot is shown below:
a) Interpret the plot by listing the data values.
b) State how many values are less than
c) State the mode.
Problem 3
Represent the following data in a stem-and-leaf plot:
Problem 4
Represent the following data in a stem-and-leaf plot:
Problem 5
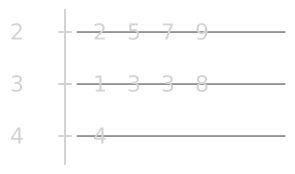
A stem-and-leaf plot is shown below:
a) Interpret the plot by writing the ordered data.
b) State the median.
c) State the range.
Problem 6
Represent the following data in a stem-and-leaf plot and then interpret it:
a) Draw the plot.
b) Identify the mode.
c) State the number of data values.
Exercises
Understanding and Fluency
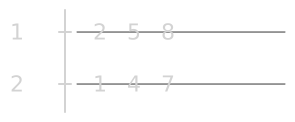
Exercise 1.
Interpret the stem-and-leaf plot:
a) List the data values.
b) State the smallest value.
c) State the largest value.
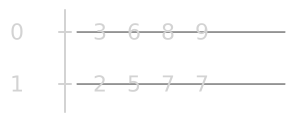
Exercise 2.
Interpret the stem-and-leaf plot:
a) List the data values.
b) How many values are shown?
c) State the mode.
Exercise 3.
Represent the data in a stem-and-leaf plot:
a)
b)

Exercise 4.
Represent the data in a stem-and-leaf plot:
a)
b)

Exercise 5.
Interpret the stem-and-leaf plot:
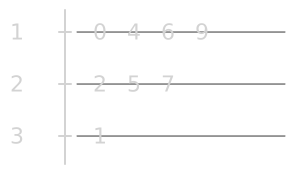
a) Write the data in order.
b) State the median.
c) State the range.
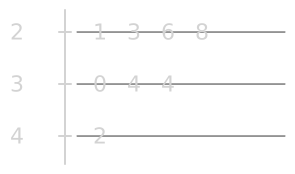
Exercise 6.
Interpret the stem-and-leaf plot:
a) Write the data in order.
b) State the mode.
c) State the number of data values.
Exercise 7.
Represent the data in a stem-and-leaf plot, then answer the questions:
a)
b) State the mode.
c) State the largest value.
Exercise 8.
Represent the data in a stem-and-leaf plot, then answer the questions:
a)
b) State the median.
c) State the range.
Reasoning
Exercise 9.
Explain why the leaves in each row of a stem-and-leaf plot should be written in ascending order.
Exercise 10.
A student reads the row
as
Exercise 11.
Explain why a stem-and-leaf plot is useful for showing the actual data values.
Exercise 12.
A student places the number
Problem-solving
Exercise 13.
The test scores are
a) Draw a stem-and-leaf plot.
b) State the mode.
c) State the range.
Exercise 14.
The numbers of books read are
a) Draw a stem-and-leaf plot.
b) State the median.
c) State how many values are in the teens.
Exercise 15.
The daily temperatures are
a) Draw a stem-and-leaf plot.
b) State the mode.
c) State the number of temperatures above
Exercise 16.
The ages are
a) Draw a stem-and-leaf plot.
b) State the median.
c) State the range.
Exercise 17.
A class records the times in minutes:
a) Draw a stem-and-leaf plot.
b) State the mode.
c) State the largest time.
Exercise 18.
The scores in a game are
a) Draw a stem-and-leaf plot.
b) State the number of scores in the twenties.
c) State the median.
Potential Misunderstandings
- Students may confuse the stem with the leaf and reverse the digits
- Students may not realise that each leaf represents a separate data value
- Students may forget to order the leaves in ascending order
- Students may join leaves together and treat them as one number instead of separate values
- Students may read
as instead of in this context - Students may place a value in the wrong stem because of weak place-value understanding
- Students may think a stem-and-leaf plot only shows grouped data rather than the actual values
- Students may make errors finding the median or range if they do not interpret the plot correctly